Personalization Features in Online Betting Platforms and Shifts in Engagement Behaviors
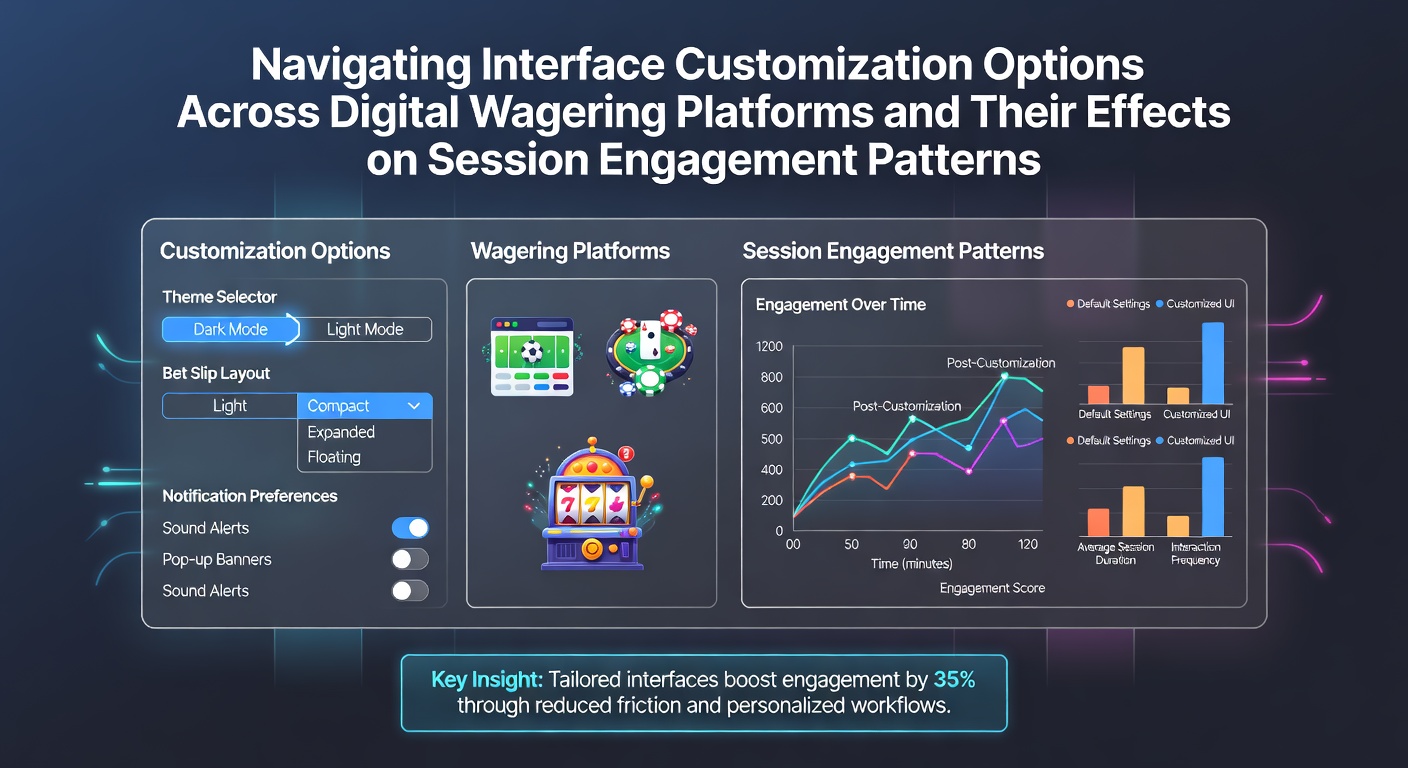
Digital wagering platforms have expanded options for users to adjust visual layouts, notification settings, and control panels, which in turn correlate with measurable changes in how long sessions last and how frequently users return. Observers note that these adjustments allow individuals to align the experience with personal preferences, while aggregated data from multiple operators reveals patterns in session duration and interaction frequency that tie directly to the availability of such features.
Core Customization Elements Available on Platforms
Users encounter sliders for adjusting bet sizes, toggles for enabling or disabling sound effects, and selectors for color schemes that range from high-contrast modes to subdued palettes, and these tools sit alongside options for rearranging dashboard elements like balance displays or quick-bet buttons. Research from industry tracking firms shows that platforms offering at least five distinct customization categories record average session lengths extending by 12 to 18 minutes compared with rigid interfaces, because participants spend additional time experimenting with settings before placing wagers. Data collected through May 2026 indicates that mobile versions of these platforms emphasize gesture-based controls and portrait versus landscape toggles, whereas desktop versions prioritize multi-window arrangements and keyboard shortcuts, creating divergent engagement curves based on device type.
Effects on Session Duration and Return Rates
When users activate personalized layouts that reduce visual clutter, session engagement metrics rise as measured by click-through rates on betting options and time spent reviewing odds, while those who leave defaults unchanged show shorter visits that end once initial wagers conclude. Studies compiled by academic groups at institutions such as the University of Nevada, Las Vegas, demonstrate that participants who customize notification frequency to receive alerts only during specific hours maintain consistent return patterns across weeks, whereas frequent pop-up settings correlate with quicker exits after the first few interactions. Figures from the Ontario Lottery and Gaming Corporation reveal that regions with widespread adoption of interface tweaks report a 7 percent uptick in weekly active users during early 2026, linking the trend to easier navigation that keeps individuals engaged without overwhelming them during peak hours.
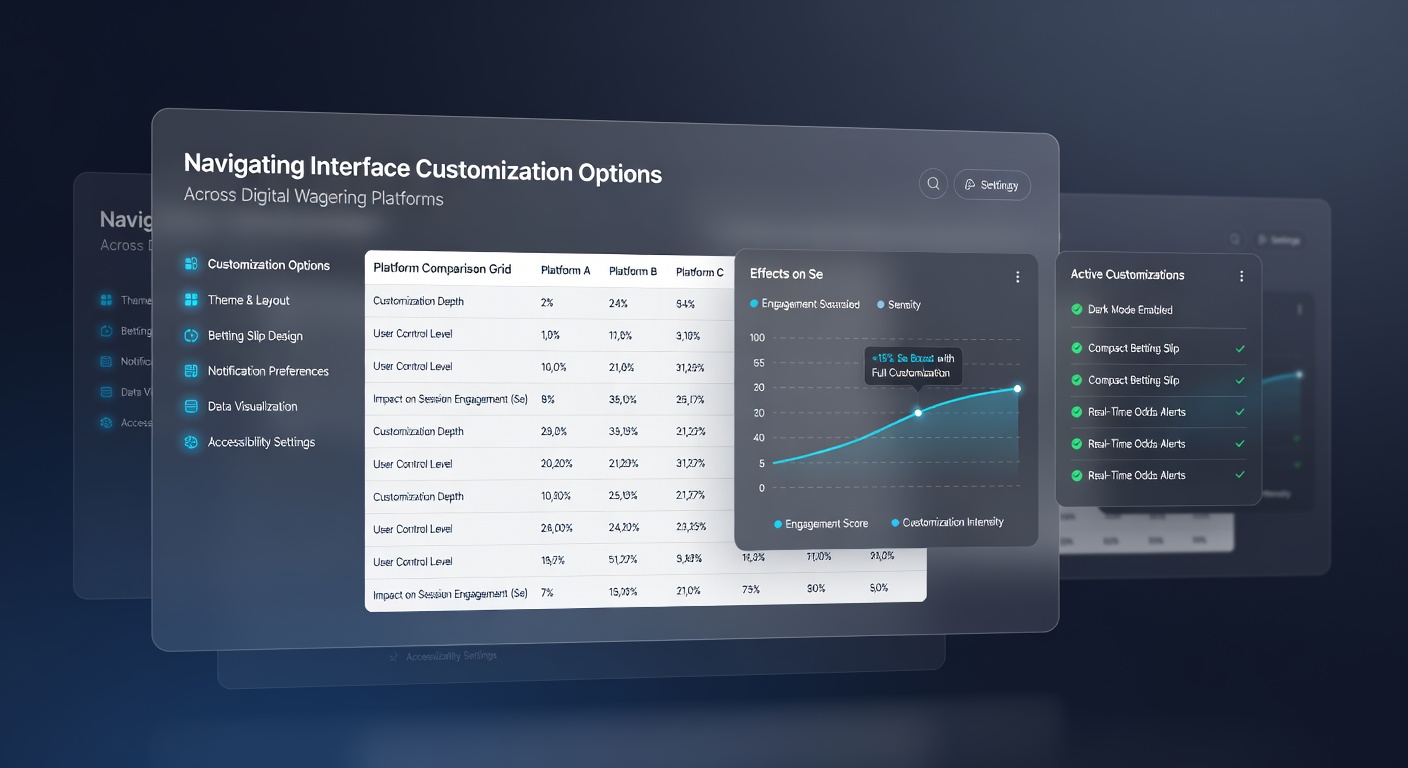
Platform operators track heat maps of cursor movement and tap locations to refine default configurations, and those refinements often incorporate user-saved preferences that carry across devices through cloud syncing, which in turn sustains longer cumulative playtime per account. What's interesting is that users who regularly switch between multiple themes exhibit higher variance in bet sizes during single sessions, suggesting that visual refreshes coincide with shifts in risk tolerance and decision speed.
Regional Variations in Feature Rollouts
European operators regulated under frameworks from the Malta Gaming Authority introduced advanced accessibility layers such as scalable text and voice-command integration ahead of many North American counterparts, leading to earlier data sets that connected these additions to steadier engagement across age groups. Australian state regulators documented similar outcomes after mandating basic contrast options in licensed apps, where session logs showed reduced bounce rates immediately following the updates. In contrast, platforms in emerging markets have focused on language toggles and currency displays that match local standards, producing engagement spikes tied more to functional clarity than aesthetic choices.
Operators continue to test A/B variations of control placements, and results feed into iterative updates that appear in user dashboards as optional patches, allowing individuals to adopt changes gradually rather than facing abrupt overhauls. Those who've studied login frequency across customized versus standard accounts find that retention holds stronger when at least one layout preference is stored within the first three visits.
Measurement Approaches and Data Sources
Analysts rely on anonymized telemetry that captures time stamps for each customization action alongside subsequent wager events, creating timelines that isolate the impact of specific toggles without attributing outcomes to individual accounts. Government reports from bodies like the New Jersey Division of Gaming Enforcement compile quarterly summaries that include breakdowns by interface type, showing consistent associations between granular control availability and extended play windows during evening hours. Industry associations publish comparative tables that benchmark average session metrics across providers, highlighting how incremental additions such as drag-and-drop bet builders contribute to cumulative engagement without altering core game mathematics.
Conclusion
Interface customization options on digital wagering platforms continue to influence session engagement patterns through measurable extensions in duration and steadier return intervals, as evidenced by aggregated reports and telemetry studies through May 2026. Operators refine these features based on device-specific usage data and regional regulatory requirements, while researchers track correlations that inform future design priorities across global markets.